 Mathematics - Functions 1 Mathematics - Functions 1
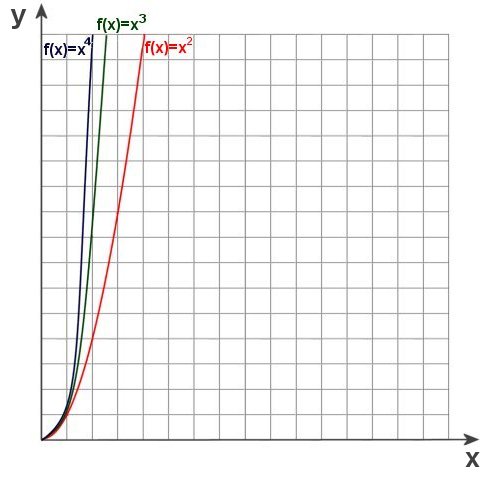
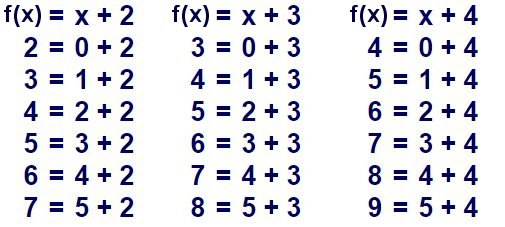
Notice how the powers affect the graphical representation. You can easily understand this calculating the grid inside the diagram:
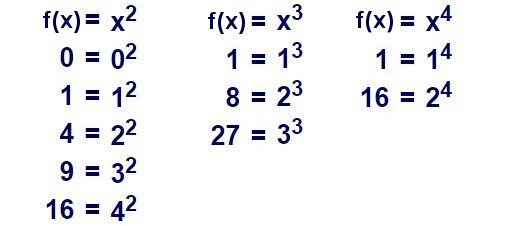
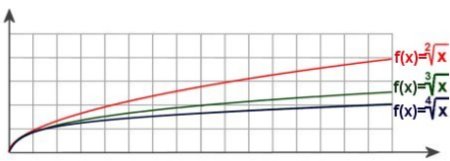
You see, the graph of the function increases more rapidly the greater the exponent becomes. But all graphs must cross the points y=0/x=0 and Y=1/X=1. This is also the case with the next graphs, which result from
multiplication.
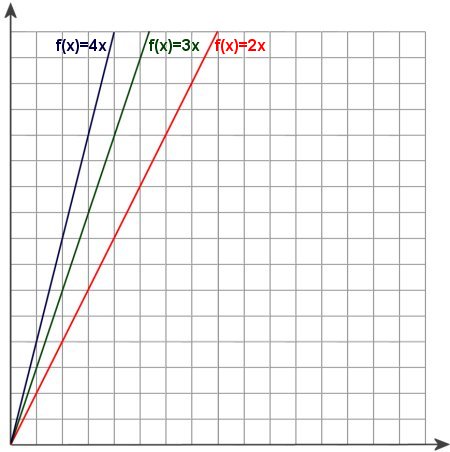
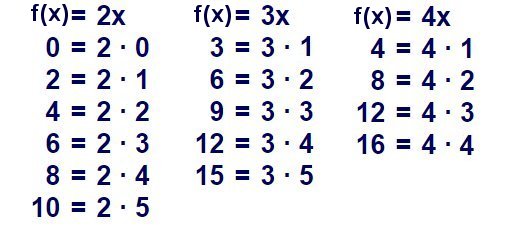
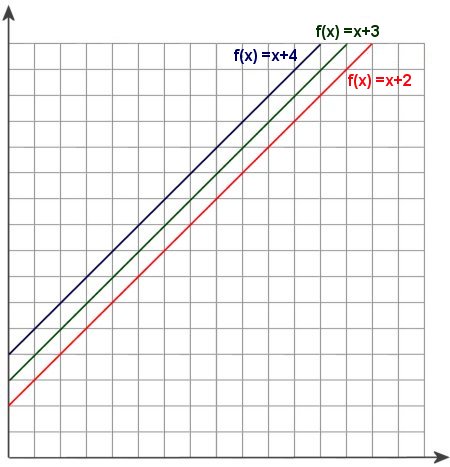
Functions that contain only addition/subtraction or multiplication/divison constants are mapped as straight lines. One also speaks of 'linear' functions. The former determine the gradient, the latter the displacement on
the y-axis.
Finally, the square, cube and fourth roots that match the top chart. The mirroring of otherwise the same graphs is immediately apparent.
|